Support Goal 1: Diversity and Inclusion
The University of Northern Iowa is committed to championing diversity as a core value of our university community. UNI will create and maintain a diverse, respectful and inclusive work and learning environment in order to prepare the university community for a constantly evolving world and so that inclusive excellence becomes the norm. This work will include challenging beliefs and practices that discriminate against, degrade, or diminish a group within our community based on the group members' innate characteristics. We believe that valuing diversity is a necessary foundation for inclusion, and that inclusive excellence provides a learning environment for our students and our community that prepares us for a dynamic, interconnected world.
Provide a campus culture that reflects and values the evolving diversity of society and promotes inclusion.
Strategic Initiatives:
-
Attract and retain diverse students, faculty, and staff who are integrated into the campus community.
-
Build and strengthen relationships with underrepresented populations in Waterloo, the Cedar Valley, and Iowa to increase diversity.
-
Build and strengthen multicultural and international relationships in the United States and abroad.
-
Provide a diversity experience for all students, and deliver programs, services, and events to educate for and celebrate diversity on campus.
-
Provide an inclusive decision-making process with broad communication and discussion.
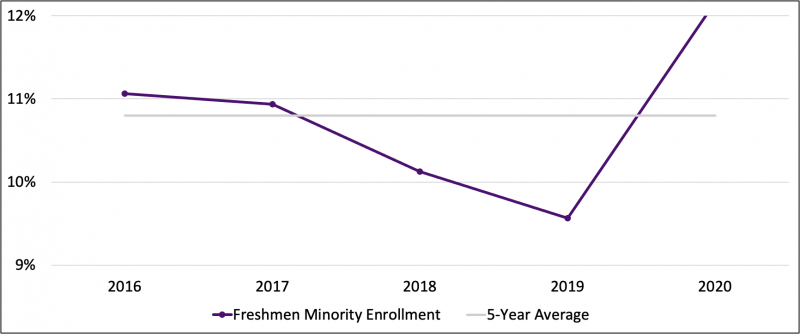
Metric: Increase the percentage of minority students in the freshmen class during the next 5 years (5-year rolling average)
| Year by Year Results |
|---|
 |
| Base Year | Current Year* | 5-Year Target |
|---|---|---|
| 2012-2016 | 2016-2020 | 2017-2022 |
| 9.9% | 10.8% | 15% |
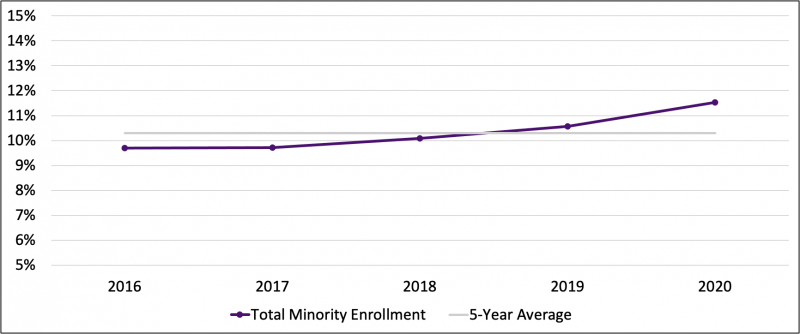
Metric: Increase the percentage of minority students of the entire student body over the next 5 years (5-yr rolling average)
| Year by Year Results |
|---|
 |
| Base Year | Current Year* | 5-Year Target |
|---|---|---|
| 2012-2016 | 2016-2020 | 2017-2022 |
| 9.2% | 10.3% | 12% |
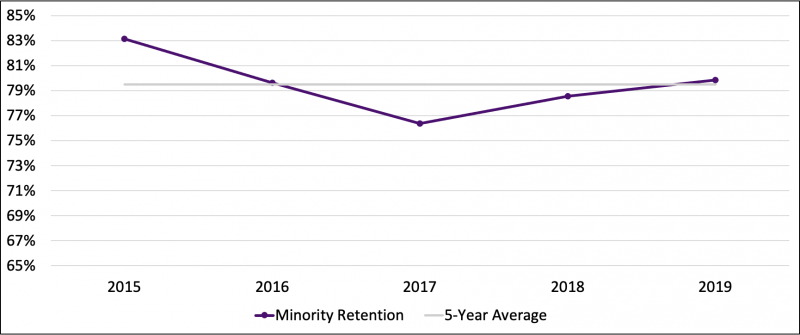
Metric: Increase the retention rates of minority freshmen to the overall retention rate (5-year rolling average 1st to 2nd year)
| Year by Year Results |
|---|
 |
| Base Year | Current Year* | 5-Year Target |
|---|---|---|
| 2011-2015 | 2015-2019 | 2017-2022 |
| 80.7% | 79.5% | 84% |
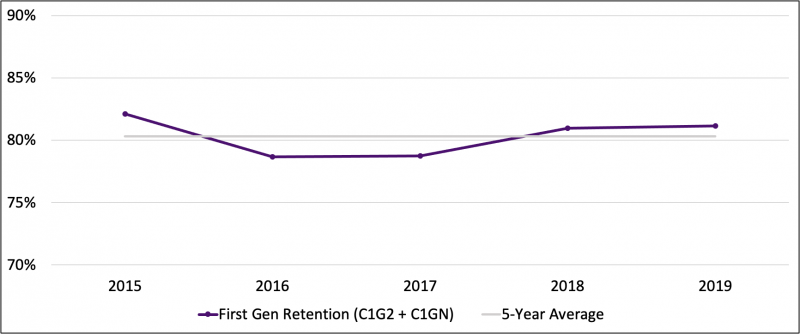
Metric: Increase the retention rates of first-generation freshmen to the overall retention rate (5-year rolling average 1st to 2nd year)
| Year by Year Results |
|---|
 |
| Base Year | Current Year* | 5-Year Target |
|---|---|---|
| 2011-2015 | 2015-2019 | 2017-2022 |
| 80.4% | 80.3% | 84% |
Metric: Increase the retention rates of freshmen receiving Pell grants to the overall retention rate (5-year rolling average 1st to 2nd year)
| Year by Year Results |
|---|
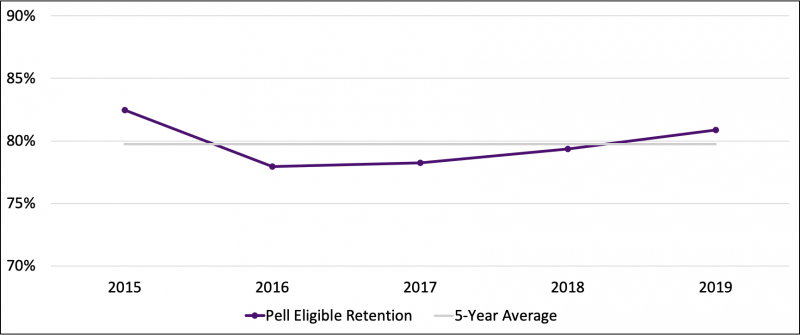 |
| Base Year | Current Year* | 5-Year Target |
|---|---|---|
| 2011-2015 | 2015-2019 | 2017-2022 |
| 81.4% | 79.8% | 84% |
Metric: Increase the percent of minority faculty over the next 5 years
| Year by Year Results |
|---|
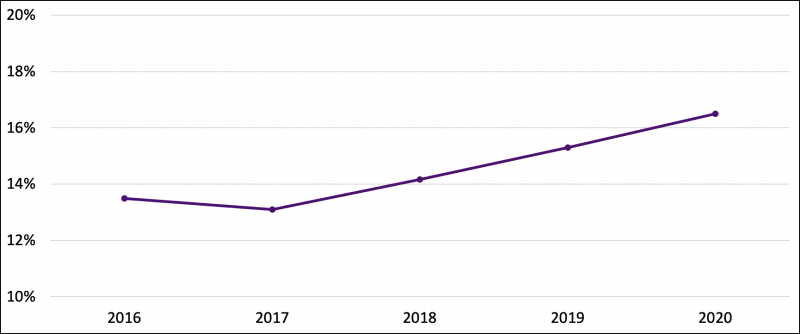 |
| Base Year | Current Year* | 5-Year Target |
|---|---|---|
| 2016 | 2020 | 2022 |
| 13.5% | 16.5% | 17% |
Metric: Increase the percent of minority administrators over the next 5 years
| Year by Year Results |
|---|
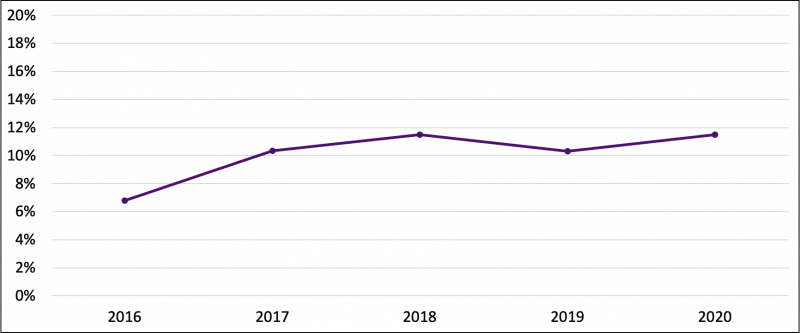 |
| Base Year | Current Year* | 5-Year Target |
|---|---|---|
| 2016 | 2020 | 2022 |
| 6.8% | 11.5% | 11% |
Metric: Increase the gender balance of female and male faculty over the next 5 years
| Year by Year Results |
|---|
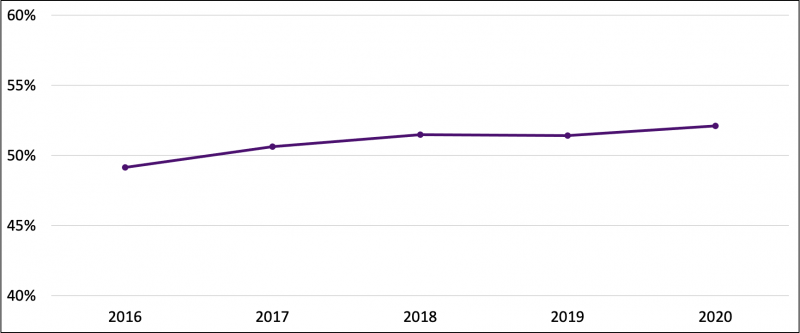 |
| Base Year | Current Year* | 5-Year Target |
|---|---|---|
| 2016 | 2020 | 2017-2022 |
| 49.1% | 52.1% | 50% |
**% of female faculty
