Support Goal 3: Community Engagement
Public-private partnerships and community relationships are central to our core mission as a comprehensive university. Through these mutually enhancing affiliations, the University of Northern Iowa is able to offer our students internships, service learning experiences, and live client projects and our partners wide-ranging benefits that support their goals. Our many successful alumni assist in our ability to recruit and retain students, raise funds to support programs and scholarship, and adapt our curriculum and programming to meet the needs of our complex, diverse, and changing world.
Create opportunities for students, faculty, and staff to build external relationships that enhance local and global learning experiences and contribute to the cultural and economic vitality of the Cedar Valley.
Strategic Initiatives:
-
Build and strengthen relationships and partnerships with Cedar Valley and statewide businesses, organizations, and educational institutions to increase diverse experiences and embrace the changing demographics and economic base of Iowa.
-
Provide all students with a community engagement experience.
-
Establish a central access point for community engagement to improve communication and promote campus engagement and participation.
-
Reward and support faculty and staff outreach and community engagement.
Metric: Increase the Percent of Participation score to 30 as reported in the NASCE survey (by fall 2019 reach 23)
| Year by Year Results |
|---|
| Base Year | 5-Year Target | |
|---|---|---|
| 2015 | 2015 | 2022 |
| 18% | 18% | 30% |
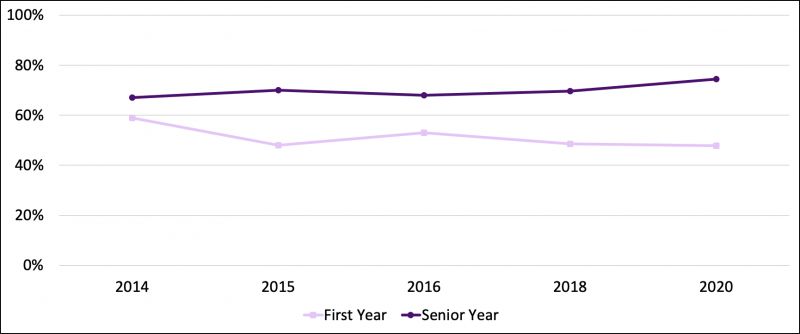
Metric: Increase percent of students that report at least some of their courses included a community-based service-learning project to 60% (first-year) and 90% (seniors)
| Year by Year Results |
|---|
 |
| Base Year | Current Year* | 5-Year Target |
|---|---|---|
| 2015 | 2020 | 2022 |
| 48%** 70%*** |
48%** 75%*** |
60%** 90%*** |
*Current Year: 2019-2020
**Freshman
***Seniors
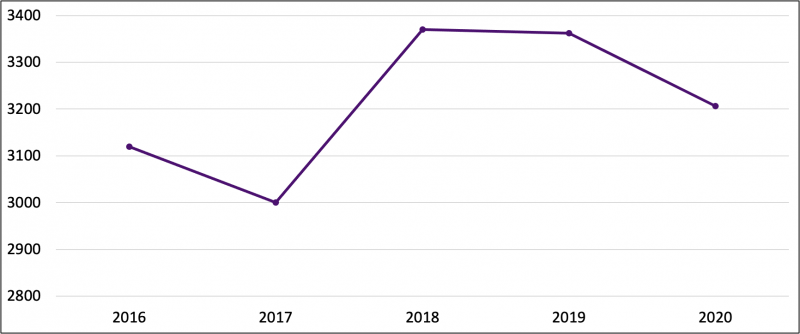
Metric: Increase the number of unique businesses and community clients served by 15% over the next 5 years (5-year rolling average)
| Year by Year Results |
|---|
 |
| Base Year | Current Year* | 5-Year Target |
|---|---|---|
| 2012-2017 | 2020 | 2017-2022 |
| 2,280 | 3,212 | 2,625 |